Analysing the results
At the end of the run, Lensed will output a summary of the statistics and a table for the parameter values. The table columns give the individual marginal mean values, standard deviations (sigma), maximum likelihood (ML) and maximum a posteriori (MAP) parameters.
summary

  log-evidence: -5123.3227 ± 0.4202
  max log-like: -5061.6840
  min chi²/dof: 1.0136

parameters

  parameter         mean       sigma          ML         MAP
  ----------------------------------------------------------
  x_L            50.5049      0.0118     50.5107     50.5001
  y_L            50.4907      0.0118     50.4901     50.5116
  r_L            17.4325      0.0062     17.4299     17.4340
  q_L             0.7491      0.0016      0.7487      0.7518
  \theta_L       45.0175      0.0821     44.9905     44.9403
  x_S            49.0356      0.0082     49.0414     49.0461
  y_S            51.7509      0.0074     51.7502     51.7606
  r_S             3.8515      0.1866      3.8357      3.8413
  mag_S          -3.0694      0.0365     -3.0691     -3.0547
  n_S             3.1509      0.0818      3.1441      3.1506
  q_S             0.8921      0.0135      0.8868      0.8795
  \theta_S       31.4591      4.0208     31.0952     28.3584
This table is meant to provide a quick overview of the results, but often does not tell the whole story of the parameter space. Lensed can further provide a number of output files which contain the full posterior distribution. These files can be analysed with statistical tools from third parties, such as GetDist.
The posterior distribution
A number of output files for the posterior distribution are created when Lensed
runs with the output = true configuration option:
<root>.txt: The chains file, compatible with GetDist. Each row contains one sample from the posterior. The (2 + number of parameters) columns contain the sample probability, -2*loglikehood, and parameter values. The sample probability is the sample prior mass multiplied by the likelihood, and normalized by the evidence.<root>post_equal_weights.dat: This file contains equally weighted samples from the posterior. Each row is thus a randomly drawn sample from the posterior distribution. The columns are the parameter values, followed by their likelihood value.<root>stats.dat: This file contains a human-readable summary of the posterior distribution. Contains the log-evidence, parameter mean values and standard deviations, together with their maximum likelihood and maximum a posteriori. If there are multiple modes, the statistics are given globally and for each of the individual modes.<root>post_separate.dat: This file is only created if the posterior is multi-model. It contains the posterior samples for each mode, separated by 2 blank lines. The format is the same as for the<root>.txtfile.<root>summary.txt: This file contains (number of modes + 1) rows. The first row contains the global statistics for the posterior. Each subsequent row is a single mode, with the following (number of parameters * 4 + 2) values: mean, standard deviation, maximum likelihood, and maximum a posteriori for each parameter, together with the local log-evidence and maximum log-likelihood values of the mode. If importance nested sampling is used, the first row contains the INS log-evidence estimate at the end.
Analysis with GetDist
GetDist is a tool for analysing and plotting posterior distributions obtained from MCMC chains. It was written by Antony Lewis and turned into a standalone Python package, after being part of the CosmoMC suite.
Installing GetDist is straightforward using the Python package manager pip:
$ pip install GetDist
For more information on how to install GetDist, and a list of requirements, see the pages of the Python package and the project on GitHub.
Once GetDist is installed, it can be used to analyse the output of Lensed right away. The syntax is
$ GetDist.py [paramfile] [root]
where either the [paramfile] or the [root] can be omitted. If no parameter
file is given, default values are used. If no root is given, it must have been
specified in the parameter file.
A sample parameter file for GetDist is available at extras/getdist.ini in the
Lensed root directory. It contains sensible defaults for analysing the results
of Lensed. Using this file, one of the provided examples can be analysed (from
the examples folder) using
examples$ GetDist.py ../extras/getdist.ini chains/test_sersic_bulge-
The output of the analysis can be found in the plots/ subfolder.
Besides analysing the posterior and finding confidence intervals and summary
statistics, GetDist can be used to create scripts for plotting one-dimensional
marginal distributions, as well as two-, three-dimensional, and triangle plots
for the correlations between parameters. Note that GetDist does not create the
plots directly. It is necessary to run the Python files at plots/<root>*.py,
for example
$ python plots/test_sersic_bulge-_tri.py
Below there are a number of sample plots from GetDist.
| Sample plots from GetDist |
|---|
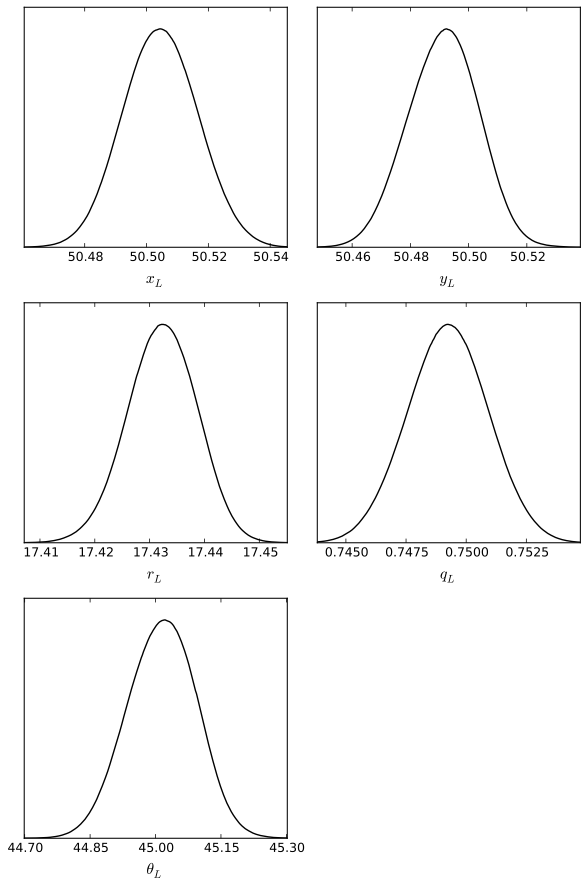 |
| One-dimensional marginal distribution |
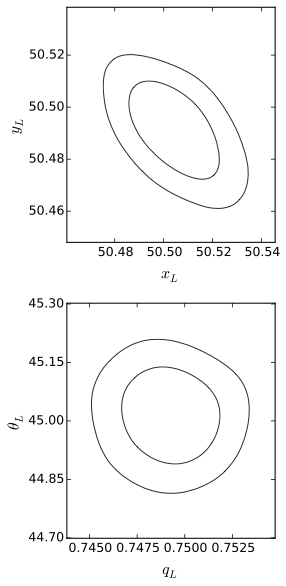 |
| Two-dimensional correlations with confidence intervals |
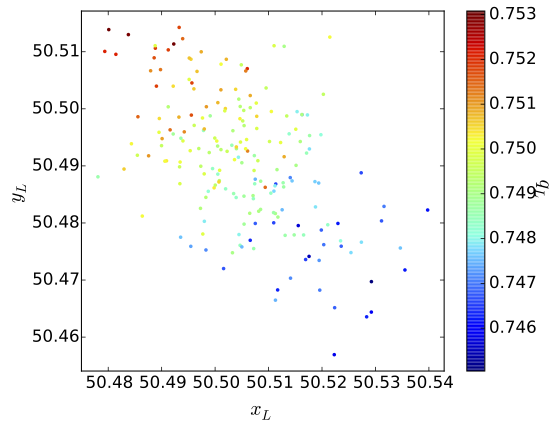 |
| Two-dimensional correlations |
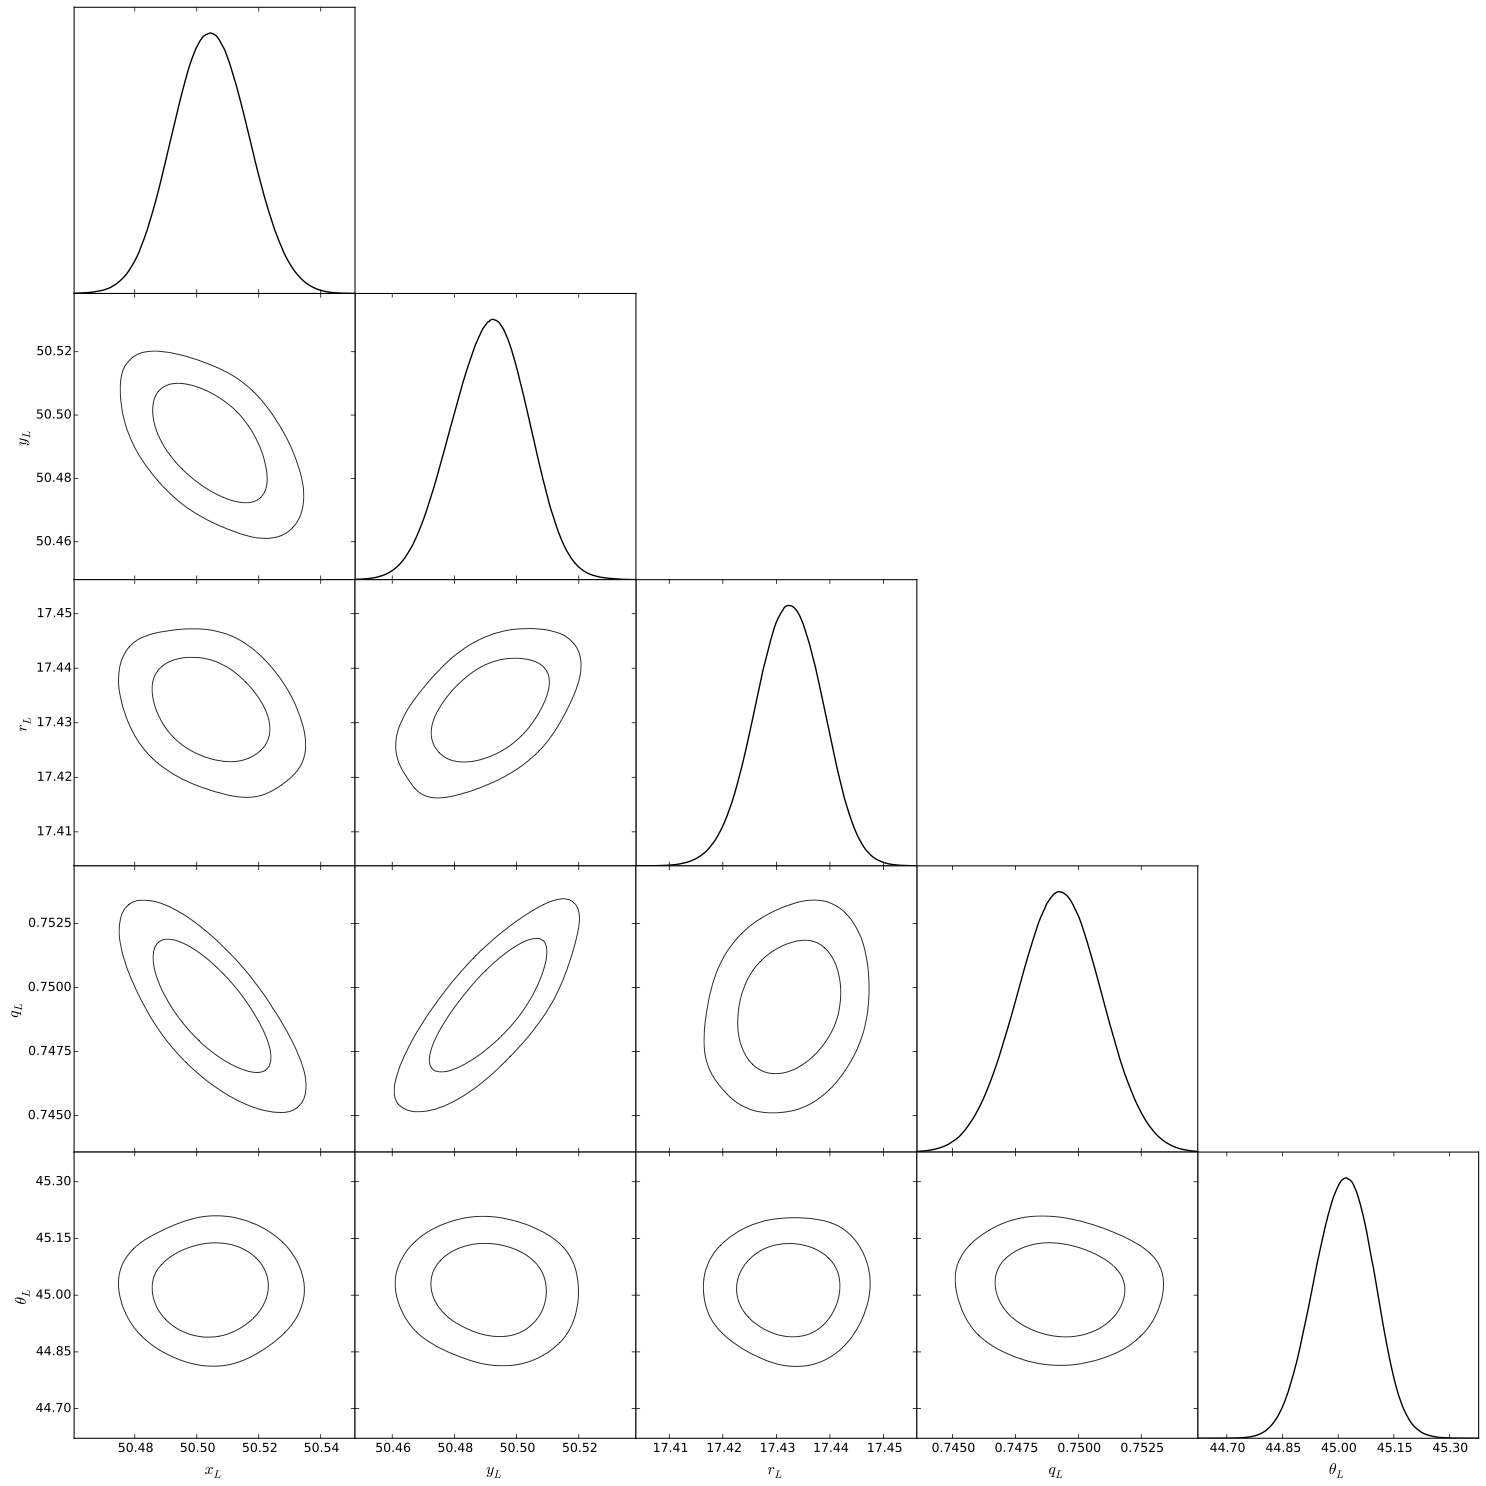 |
| Triangle plot |